Debugging
In this article, we discuss how to analyze and resolve Twig-related issues. Twig is a compiled language, that means, that errors regarding the syntax will already be found and raised during compilation — with helpful exception messages (well most of the time). But there are other occasions: from simply being stuck when writing a template to resolving runtime errors, i.e. those that only happen when the templates are finally executed.
- How to avoid errors in the first place with DX things like autocompletion?
- What inheritance hierarchy did the system build from my templates?
- How do I debug runtime issues?
IDE support
A good IDE can help your understanding a lot by providing autocompletion for syntax, files and objects. Giving your
files a .twig extension is enough to enable language support in most modern IDEs.
If you are using PhpStorm with the (excellent!) Symfony plugin, you can go a step further and get context-sensitive autocompletion. If your IDE can do the following things as well, please feel free to edit this page and include it as well!
Namespace mapping (PhpStorm only)
In the dev environment, the ContaoFilesystemLoaderWarmer will dump a special .ide-twig.json file into your var
directory, that includes a mapping of all registered namespaces and filesystem locations. With that, you’ll get
template name autocompletion, even for the managed @Contao namespace.
You will now also able to navigate to referenced templates by holding down Ctrl and clicking on the name.
Type resolution (PhpStorm only)
You can also get full autocompletion for template parameters like you would inside a code file. For explicitly stated
templates in render() calls, the types can get inferred, for other cases (most of the time in Contao), you can still
get autocompletion by adding a type annotation inside the template:
debug:contao-twig command
A Contao application can consist of hundreds of templates, and they are all part of a big template hierarchy. This is
why there is the debug:contao-twig command, that helps you get a visual representation of what is going on.
You should always use it, if the template, you are expecting, is not available or an unwanted template takes it place.
Pass a template name prefix as the first argument to filter the results. The optional parameter --tree renders the
result in tree form (handy, for example, when you want to find templates and their variants).
debug:contao-twig
debug:contao-twig --theme my_theme
debug:contao-twig content_element/te
debug:contao-twig content_element/text --tree
The output also includes a short preview of the file as well as the identified blocks. If you also want to include
templates of a certain theme, use the --theme <slug> option and pass in the theme slug.
Here is a typical problem that you could narrow down using the debug:contao-twig command: Are you missing a template,
and, while debugging, found out, that it is indeed there, just without the directories in the template name? So for example
@Contao/foo.html.twig instead of @Contao/content_element/foo.html.twig? Then, you are most likely missing a
.twig-root file — refer to this explanation to find out more!
Runtime issues
The issues, that are the hardest to deal with, are those that only happen at runtime. This could be an unexpected type passed to the template, a missing parameter, and so on…
Dumping
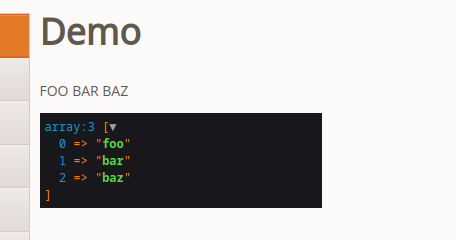
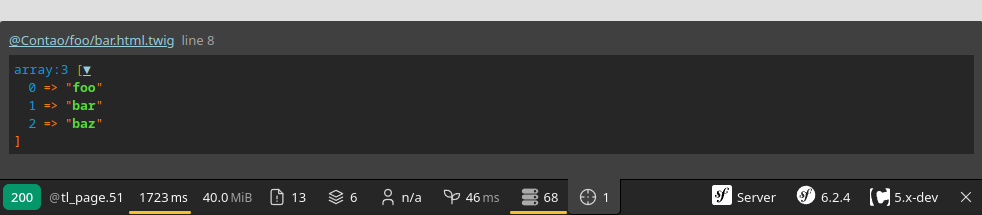
The most straightforward way to understand what’s going on, is to use the dump() function.
It is basically a wrapper around var_dump and will generate a nicely formatted listing of your template parameters
with types. The result is rendered in place:
{# Dump everything #}
{{ dump() }}

{# Only dump what's inside "a" and "b" #}
{{ dump(a, b) }}
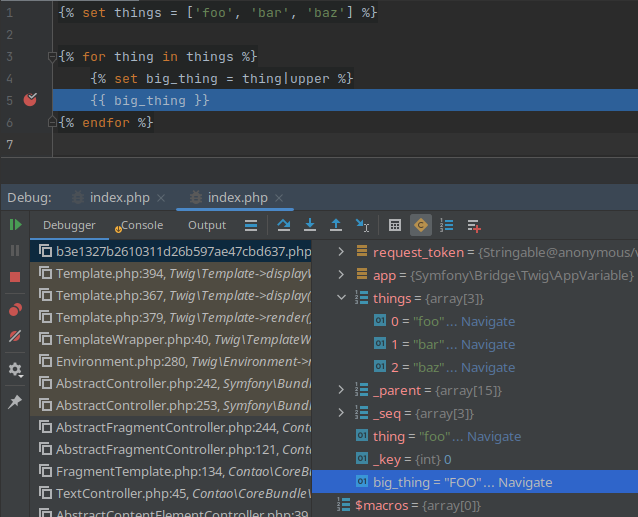
Alternatively, you can use the {% dump %} tag from the Symfony Twig bridge. With this tag, the dump output won’t be
displayed, but send to the VarDumper component instead. You can then find the results, when clicking the target icon
in the Symfony Web Debug Toolbar:
{# Dump everything #}
{% dump %}

{# Only dump what's inside "a" and "b" #}
{% dump a, b %}
In dev mode, the profiler extension will add profiling statements to all compiled templates. The results are also
available in the Symfony Web Debug Toolbar (check the Twig section): template, block and macro calls, a listing of all
utilized templates with counts, dependencies and render times. Neat!
Dumping, especially without constraining to a parameter, could pose a security risk in your application if it would
happen on a productive site (the global app variable for instance would leak the request stack including things like
server variables!). That is why it is only available in the dev environment.
File cache and debugging breakpoints
The way Twig is configured in Contao (or really a regular Symfony application), is to dump the compiled templates onto disk as a PHP file. When rendering, the (one-time) compiled file is then simply executed. This is very effective, especially if you consider things like opcode caching that can be fully utilized with this strategy.
In the dev environment, you’ll find the resulting files in your var/cache/dev/twig directory. For each template, a
separate file will be created (there are some exceptions, but you’ll find your way) — the file name is a hash, though.
To find a file, you can search for a comment /* @Contao/<name>.html.twig */, that Twig adds to the very top of the
file.
For each block or macro, you’ll find a function. The used Twig functions, filters, block calls and the like were
translated to PHP code. You’ll also see the escaper in action if you look for lines that start like
echo $this->env->getFilter('escape')->….
For tough problems, you might want to set breakpoints inside these files and step through them line. Yes, in the end they are just regular PHP files, that you can debug with tools like XDebug. Some IDEs (such as PHPStorm) even support direct debugging in the template files itself, if you tell them where to find the cache files: